Research Dashboard
A real-time web interface for managing experiment campaigns, monitoring workers, and analysing results.
Overview
The XeeNet dashboard is the control centre for the platform. Researchers use it to create experiment briefs, monitor distributed training progress, and analyse results across campaigns. Built with HTMX for real-time updates, Jinja2 templates, and Pico CSS for a clean, responsive interface.

Research Briefs
Research briefs are the starting point for every experiment campaign. A brief defines the research goal, compute budget, and target hardware profile. The orchestrator automatically decomposes each brief into concrete tasks with unique hyperparameter configurations.

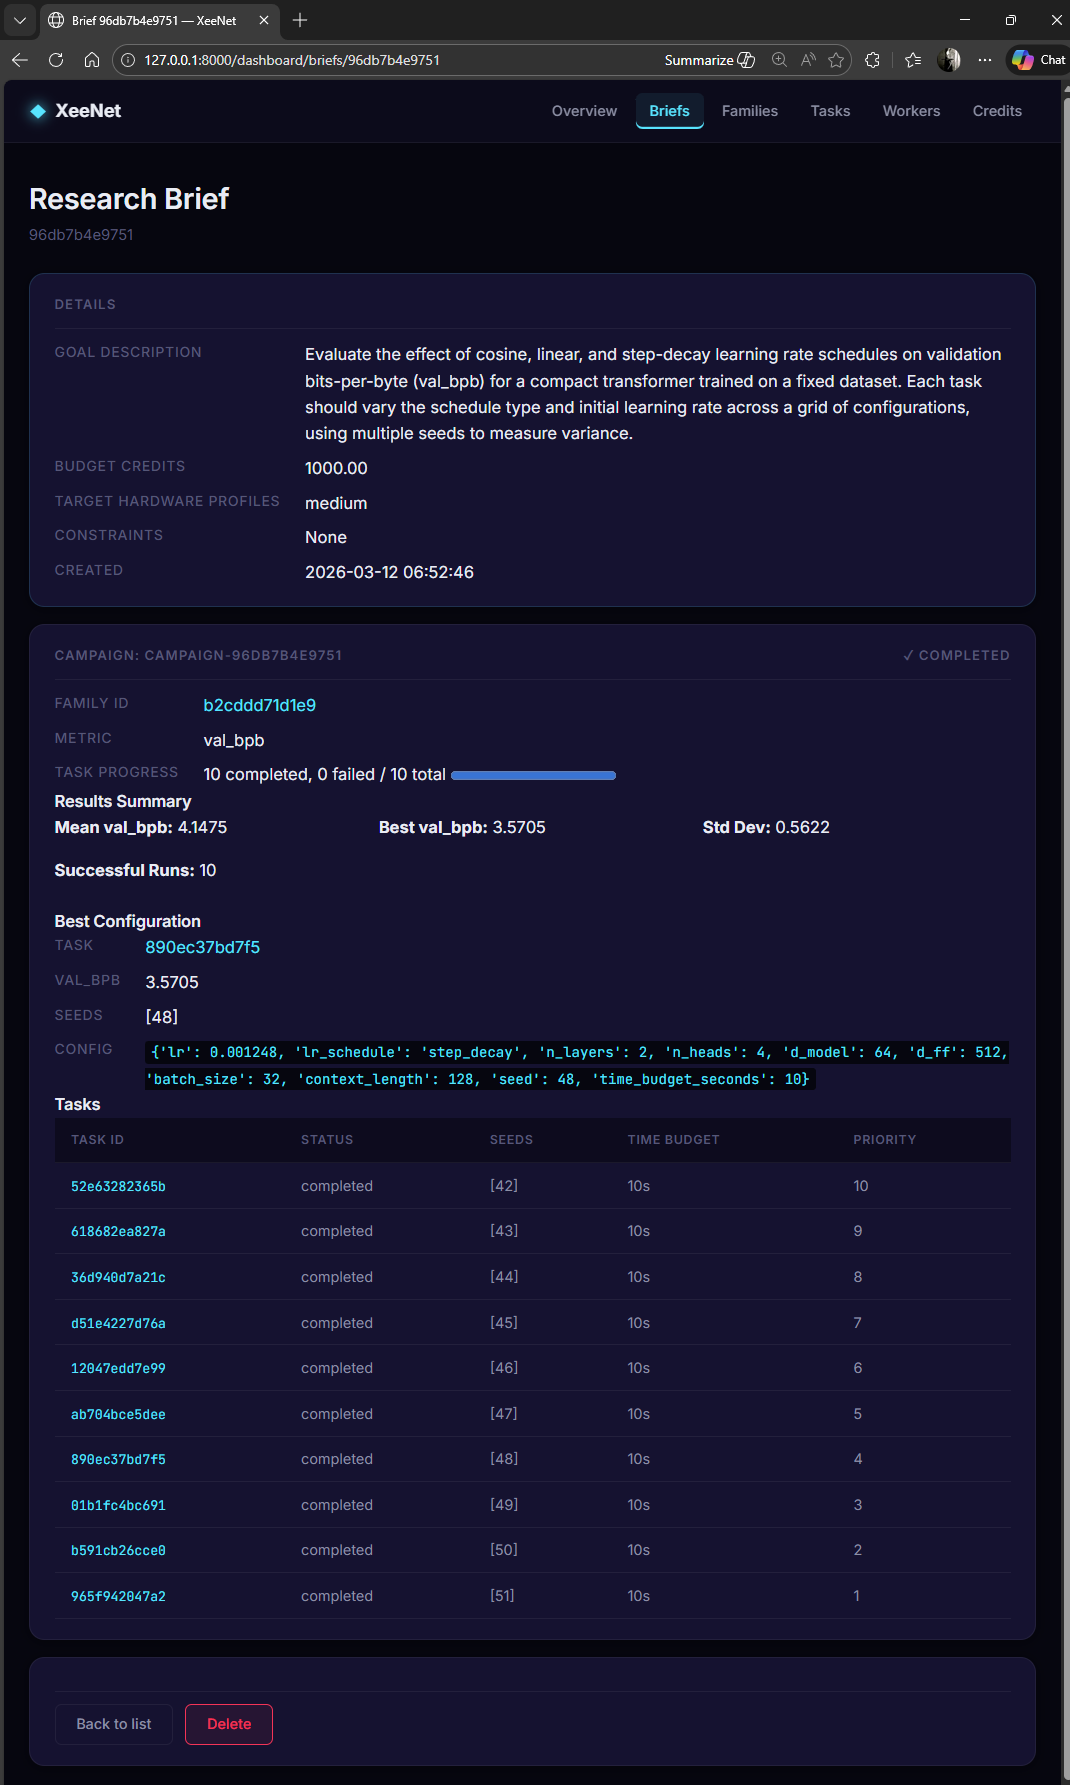
Campaign Results
The brief detail page shows the full lifecycle of a campaign: from the research goal through to aggregated results. Key metrics include best val_bpb, mean/standard deviation across all runs, and the winning hyperparameter configuration.
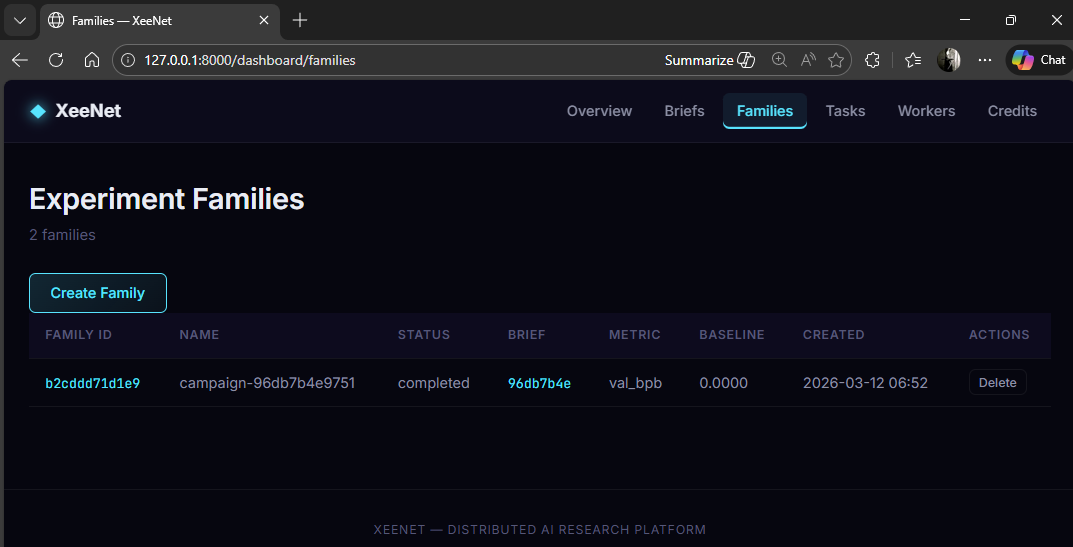
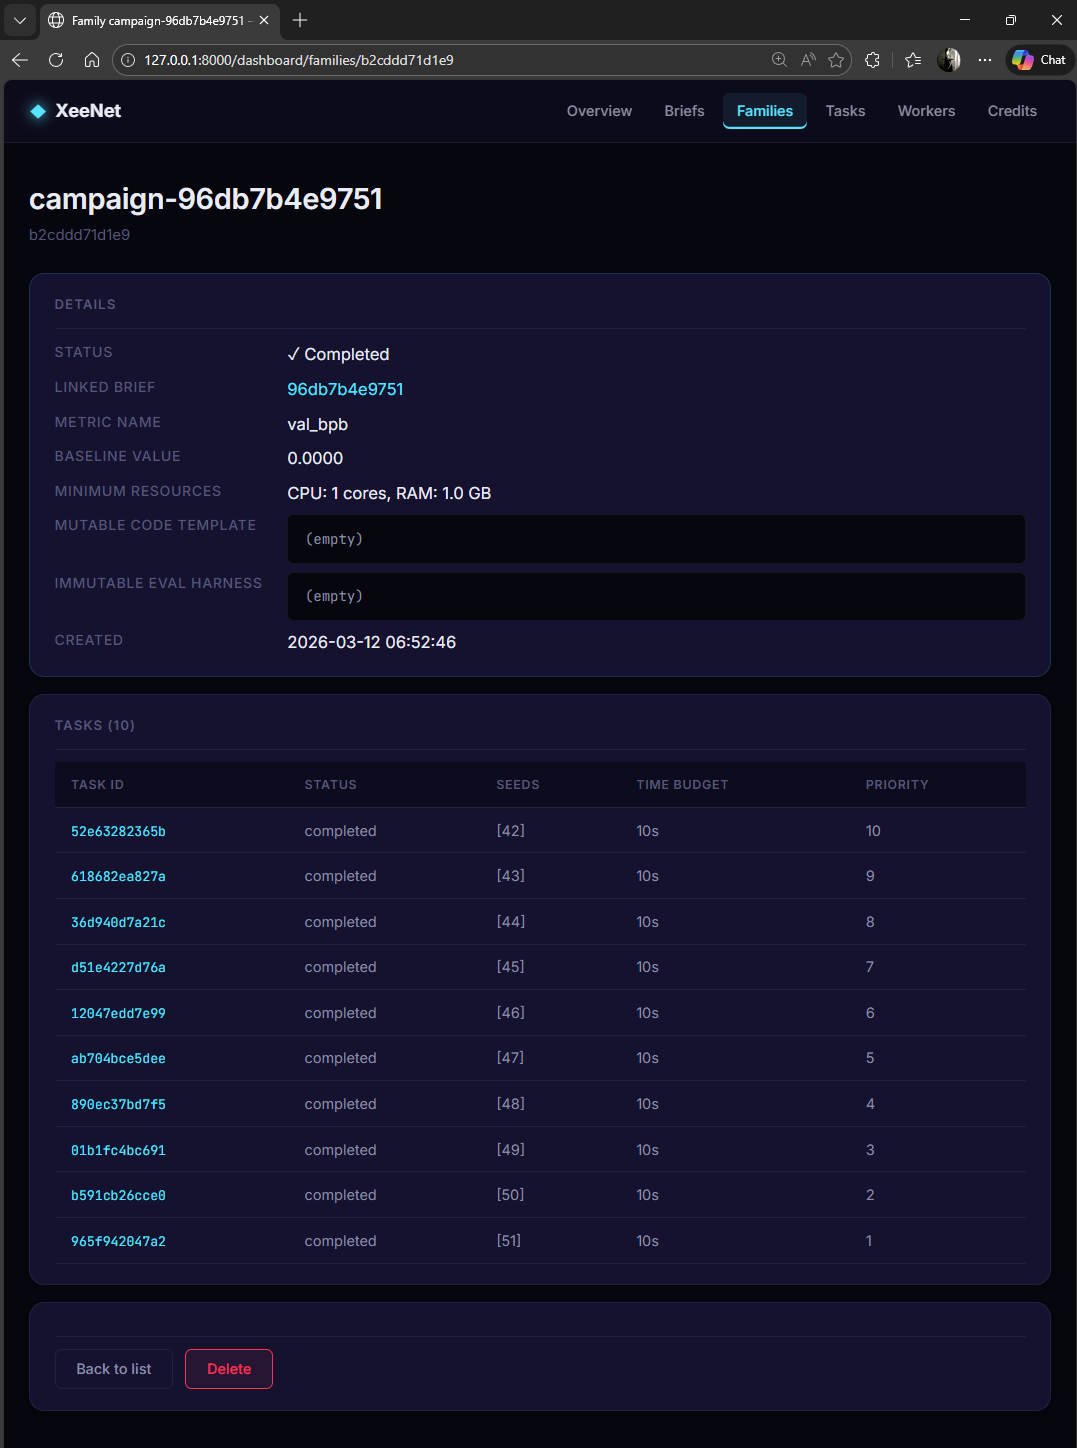
Experiment Families
Each brief generates an experiment family (campaign) containing all related tasks. Families track the metric being optimised, completion status, and linked brief.
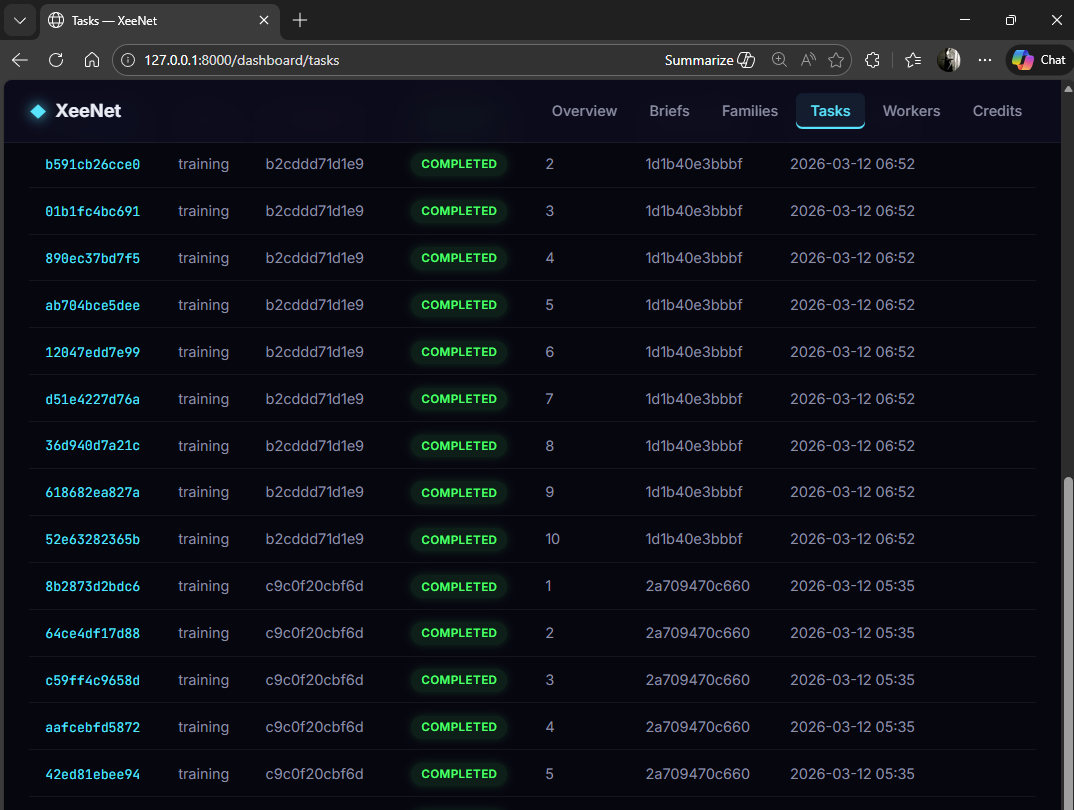
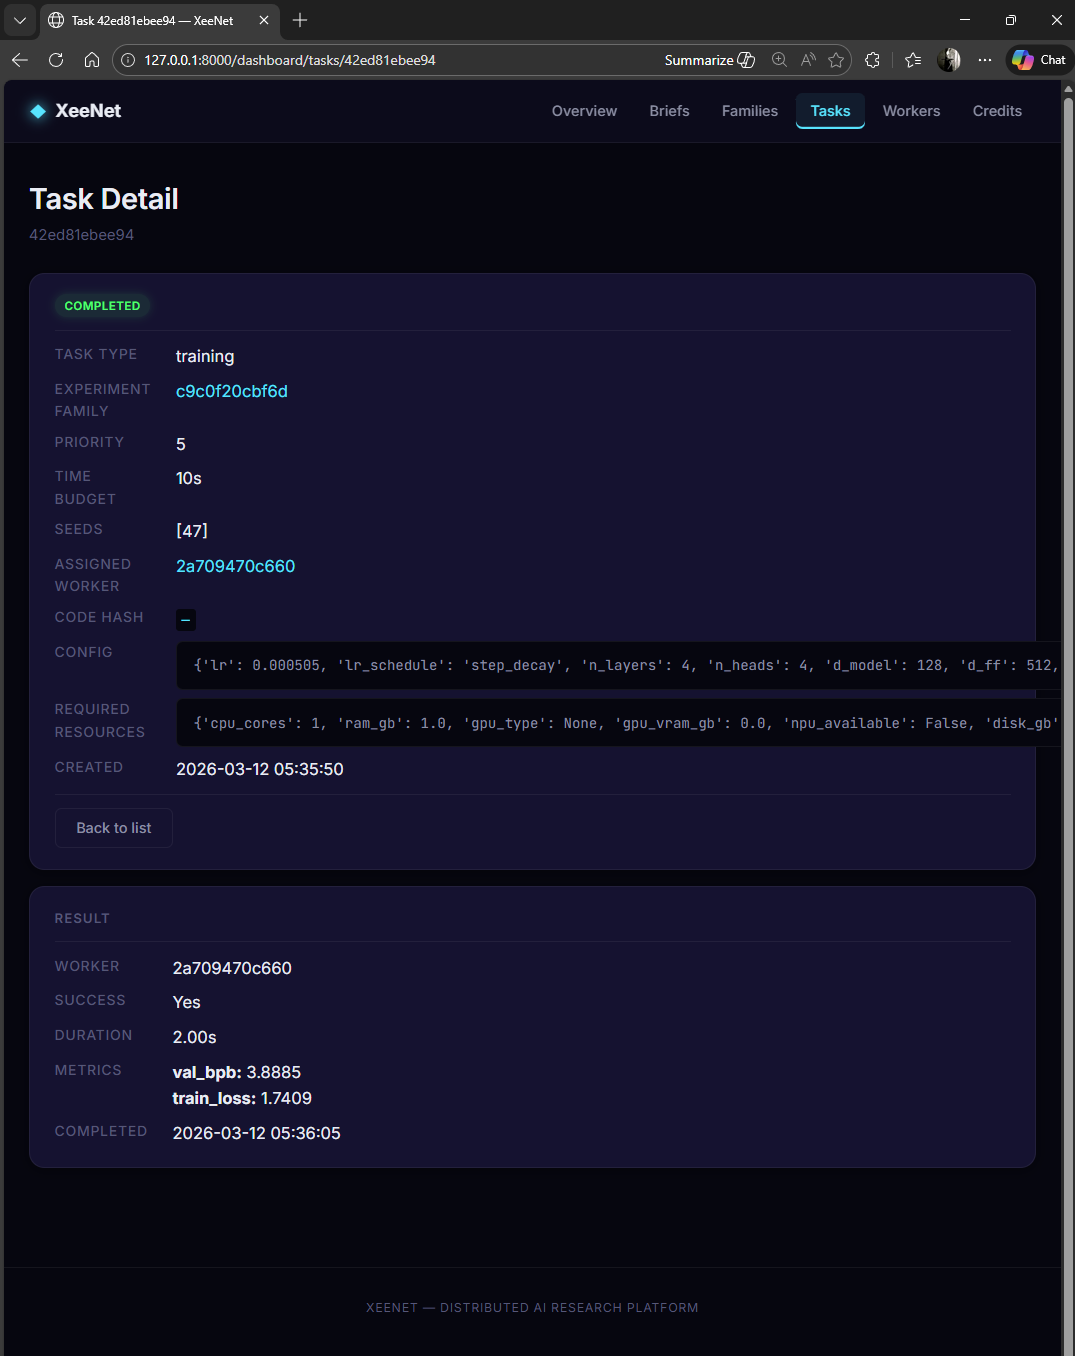
Task Management
Tasks are the atomic units of work. Each task represents a single training run with a specific hyperparameter configuration, time budget, and seed. The tasks view shows all tasks across all campaigns with their completion status.
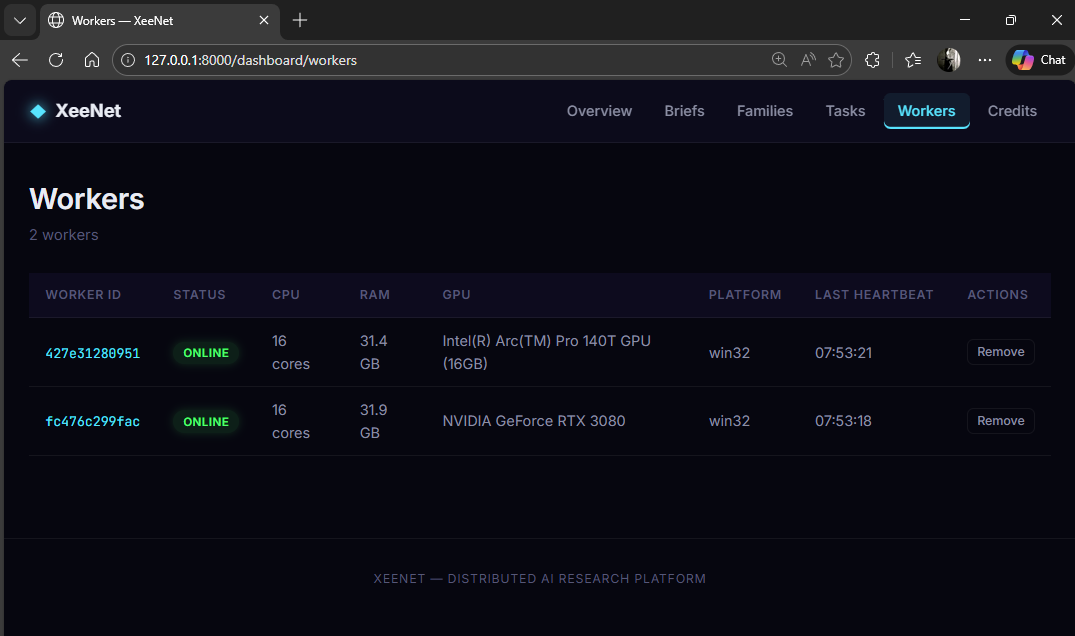
Worker Monitoring
The workers page tracks all registered nodes in the network. Each worker reports its hardware profile (CPU cores, RAM, GPU model and VRAM), platform, and heartbeat status.
Technical Implementation
Template Architecture
The dashboard uses ~15 Jinja2 templates with a shared base layout. HTMX attributes handle dynamic content loading without full page refreshes:
| Template | Purpose |
|---|---|
_base.html |
Base layout with navigation, Pico CSS, HTMX includes |
home.html |
Platform overview with live statistics |
briefs_list.html |
All research briefs with status badges |
brief_detail.html |
Campaign results, best config, task breakdown |
workers_list.html |
Connected workers and hardware profiles |
credits_overview.html |
Credit balances and transaction history |
_stats_partial.html |
HTMX partial for auto-refreshing statistics |
No Build Step
The dashboard is pure server-side rendering. Static CSS and minimal JavaScript
live in static/. HTMX handles dynamic updates via HTML-over-the-wire.
This eliminates the entire frontend build pipeline: no webpack, no bundler,
no node_modules. Run uvicorn services.api.main:app and the dashboard
is ready.